STUDY
Checkout Optimization Across a Multi-Brand E-commerce Ecosystem
A checkout flow that violated user expectations at every critical decision point, costing the business its most valuable transactions during its highest-revenue windows.
SECTION 01WHAT THIS CASE STUDY WON'T TELL YOU
- Exact revenue impact is omitted under business confidentiality. The +30% conversion lift translates to a material number; I can discuss magnitude in conversation, not in writing.
- Several A/B tests failed before the winning patterns surfaced. I'm showing you the patterns that shipped, not the ones we abandoned.
- I did not run the quantitative analysis personally. The growth analytics team owned measurement; I owned the hypothesis and the design.
- Multi-brand constraints meant some ideal solutions could not be implemented uniformly. The case study notes where compromises were made.
- Some screenshots are reconstructed from production for presentation clarity. No customer data is real.
SECTION 02STAKES
I worked on FTD and its affiliated brands (ProFlowers, FromYouFlowers, SendFlowers), a gifting ecosystem serving customers across 125+ countries through a network of 30,000+ florists. Revenue was concentrated in seasonal peaks (Mother's Day, Valentine's Day) where any UX decision compounded across millions of sessions in a two-week window.
The checkout funnel was underperforming benchmark, and the gap was costing the business its highest-margin transactions at the worst possible time of year. Drop-off at the fee-reveal step was 34% higher during peak weeks than baseline, meaning the product's pricing model was actively adversarial to the windows the business most needed to capture.
The mandate was a checkout redesign. What the work became was something larger.
SECTION 02ROLE
I led design across the purchase journey, PDP, cart, checkout, and the design system that supported all four brands. I partnered with a director of product and two product owners (one for checkout, one for PDP/cart), worked day-to-day with eight engineers and four QAs across the release waves, and aligned weekly with two executive stakeholders on scope and sign-off. A growth analyst owned all A/B test instrumentation, and a UX research partner ran the qualitative interviews and session-replay analysis.
I owned the experience architecture, the decision framing, the design system standardization across brands, and all visible UI. I did not own A/B test methodology or statistical analysis, that was the growth analyst's domain, and I did not own the technical checkout infrastructure.
SECTION 03REFRAME
The project I was briefed on and the project I actually shipped.
The brief was a conversion problem.
I was handed a checkout with a 30-day trailing conversion rate below benchmark and a clear mandate: redesign the funnel, lift the number. The framing assumed the checkout was where the problem lived. Fix the checkout, recover the conversion. That's a tractable project. I could have shipped against it in a quarter.
I didn't ship against it.
What the session data showed was a different problem.
Three weeks into discovery, the pattern in the FullStory data stopped looking like a checkout problem. Users weren't failing at the checkout. They were arriving at the checkout already primed to fail, with wrong price expectations from the PDP, with delivery assumptions the system hadn't validated, with an emotional investment in a product that might not even be available to them. By the time a user hit step one of checkout, the damage had been done five minutes earlier, on a different page.
The rage-click signatures confirmed it. The highest-intensity frustration wasn't on the "Place Order" button. It was on the order summary, the moment the delivery fee rendered. Users weren't abandoning because the checkout was broken. They were abandoning because the promise the site had made them upstream was being revised at the last step.
The checkout isn't the problem. The checkout is where the problem becomes visible.
Everything changed downstream of that sentence. The scope expanded past the original brief to include the PDP (where the price commitment starts), the product detail flow (where delivery eligibility should be resolved), the cart (where pricing has to hold its promise), and the design system (because whatever we built had to work identically across four brands). The original project, a checkout redesign, would have moved the number marginally. The redefined project, a trust-restoration exercise spanning the whole purchase journey, is what moved it by 30%.
What this meant practically:
I had to defend a scope expansion to a stakeholder group that had approved a checkout project, not a journey project. That conversation took longer than the initial discovery. I brought the session data, the rage-click density maps, and a specific counterfactual: if we ship the checkout-only version, here's the lift we'd expect, and here's why it ceilings out. The ceiling argument was what moved the room. Once the stakeholders could see that the in-scope work had a fixed upper bound, the scope expansion became the obvious choice.
The work I actually shipped was not the work I was briefed on. That delta is the project.
SECTION 04DECISIONS
Three calls that moved the number.
03 HERO DECISIONS · 04 SUPPORTING MOVES · TAP A CARD TO OPEN
SECTION 04.BSUPPORTING MOVES
Four decisions that didn't need a full story, but earned their place in the 30%.
Seven decisions. Three that moved the number. Four that compounded it.
+30% conversion · −25% abandonment · −20% errors
SECTION 05SOLUTION
Six surfaces where the decisions shipped.
SCROLL FOR ANNOTATED SURFACES
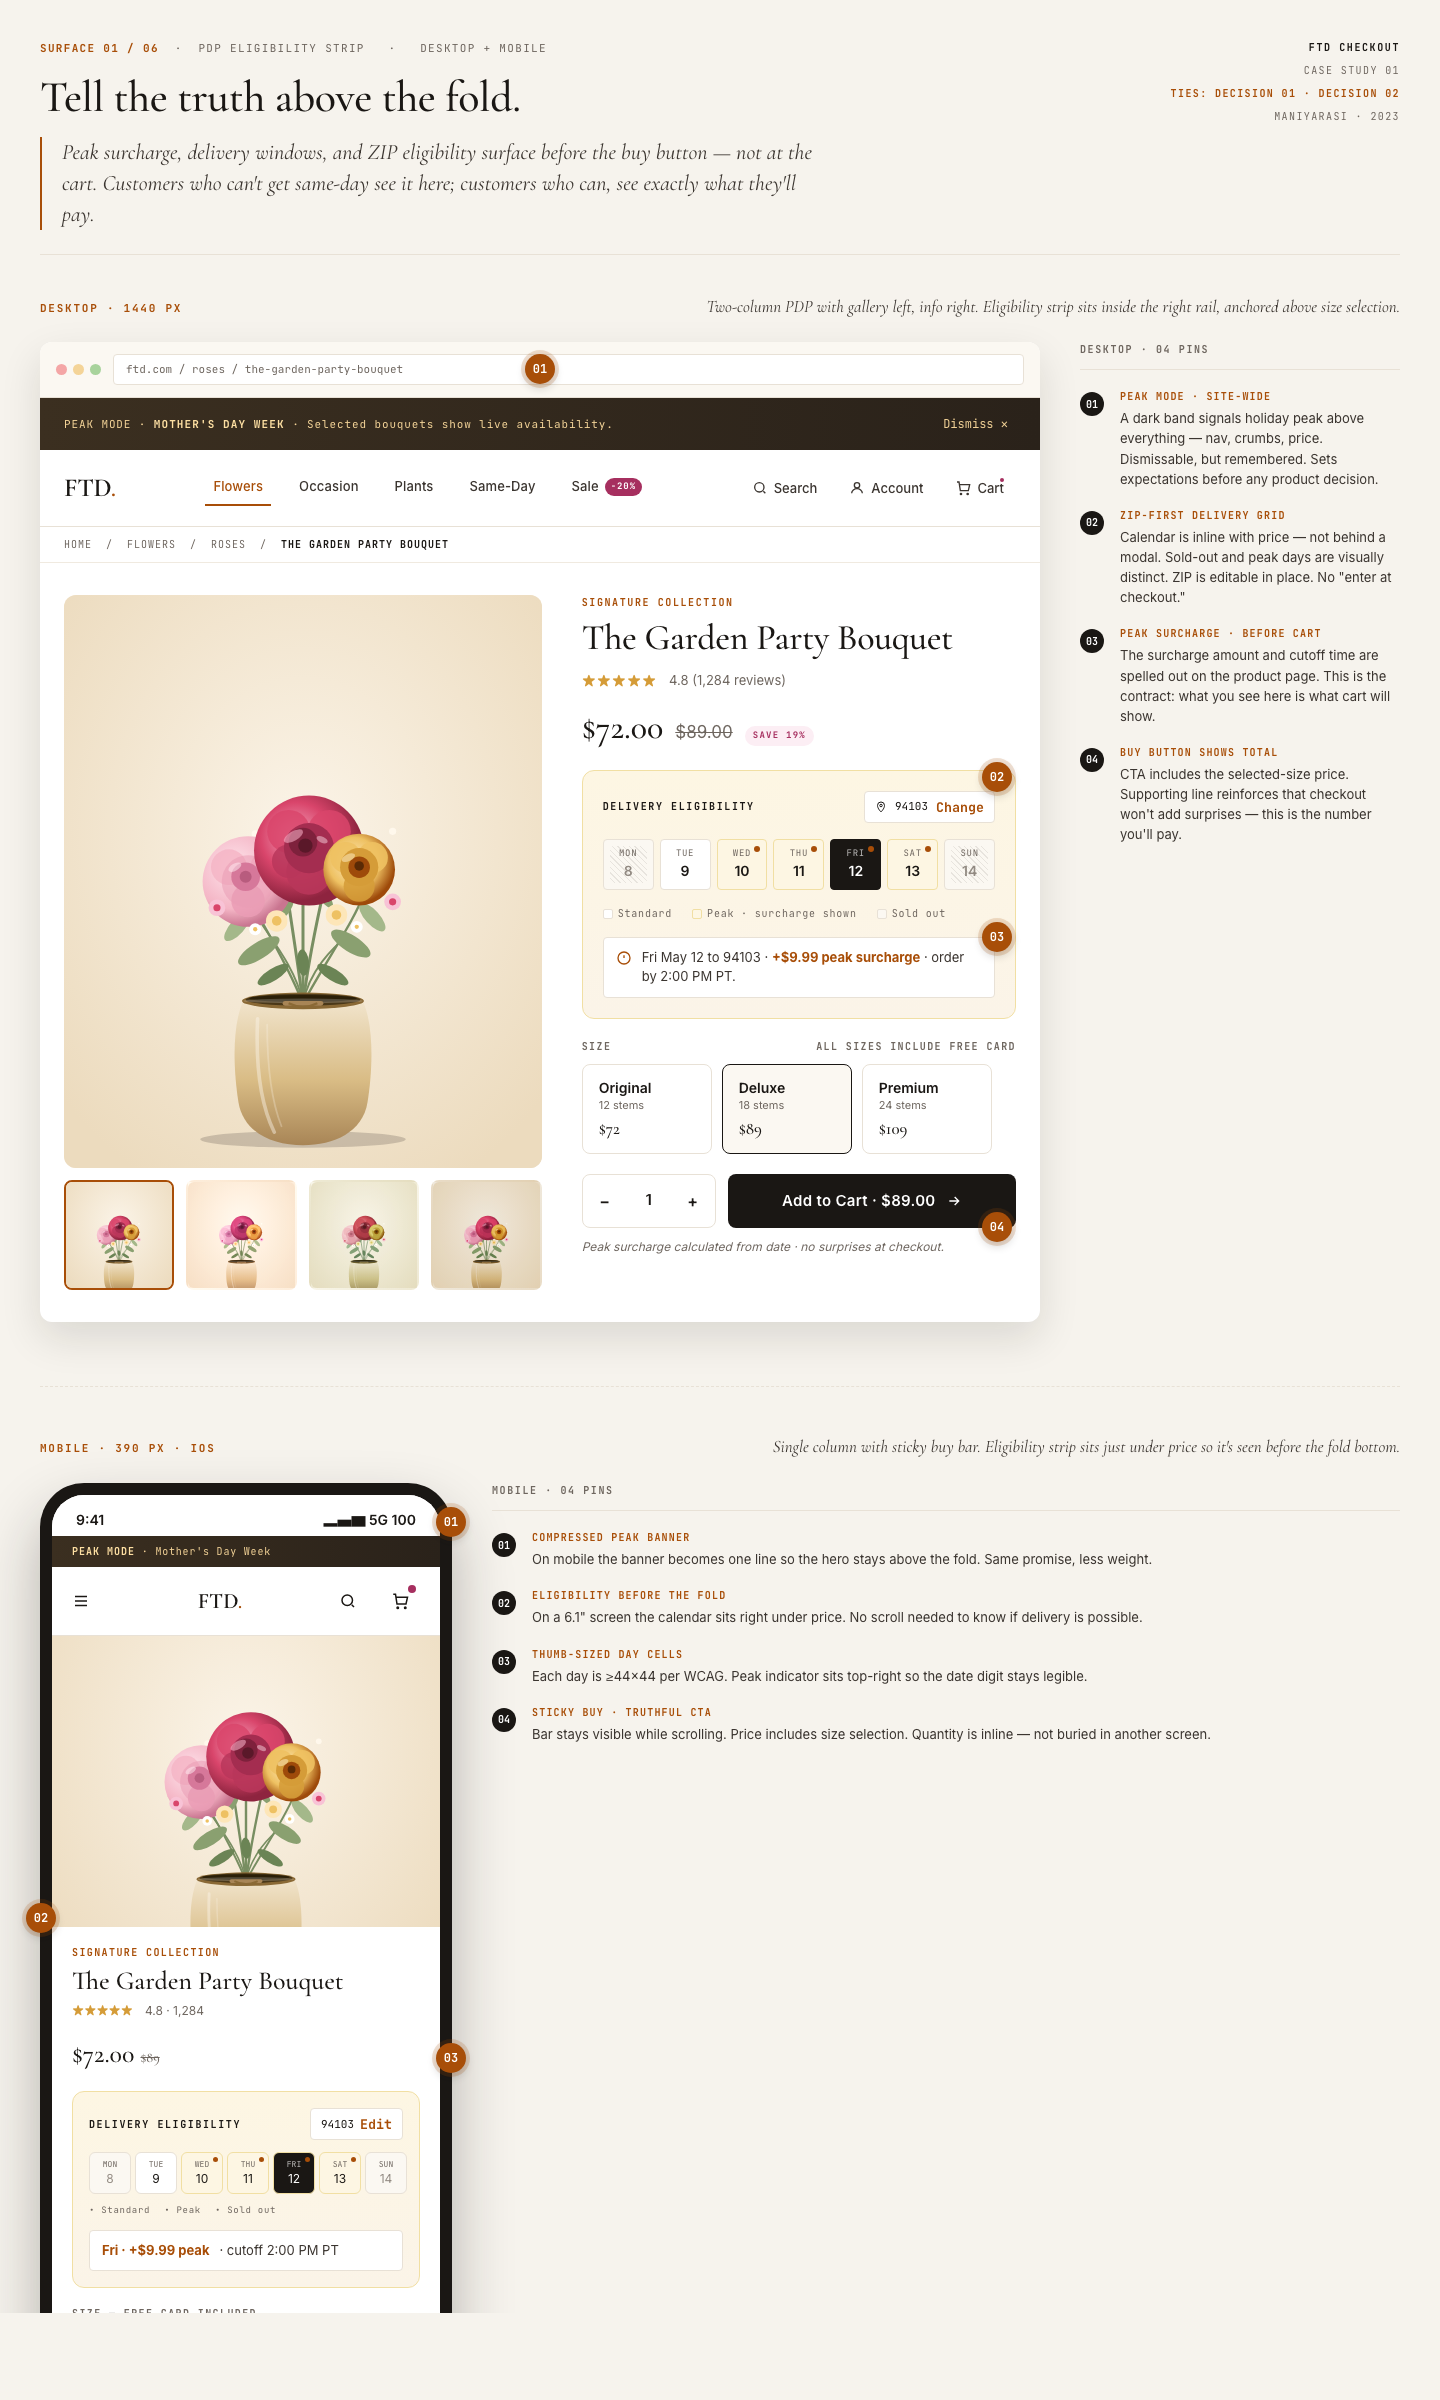
PDP, ELIGIBILITY STRIP
Validation lives at the moment of interest, not the moment of commitment.
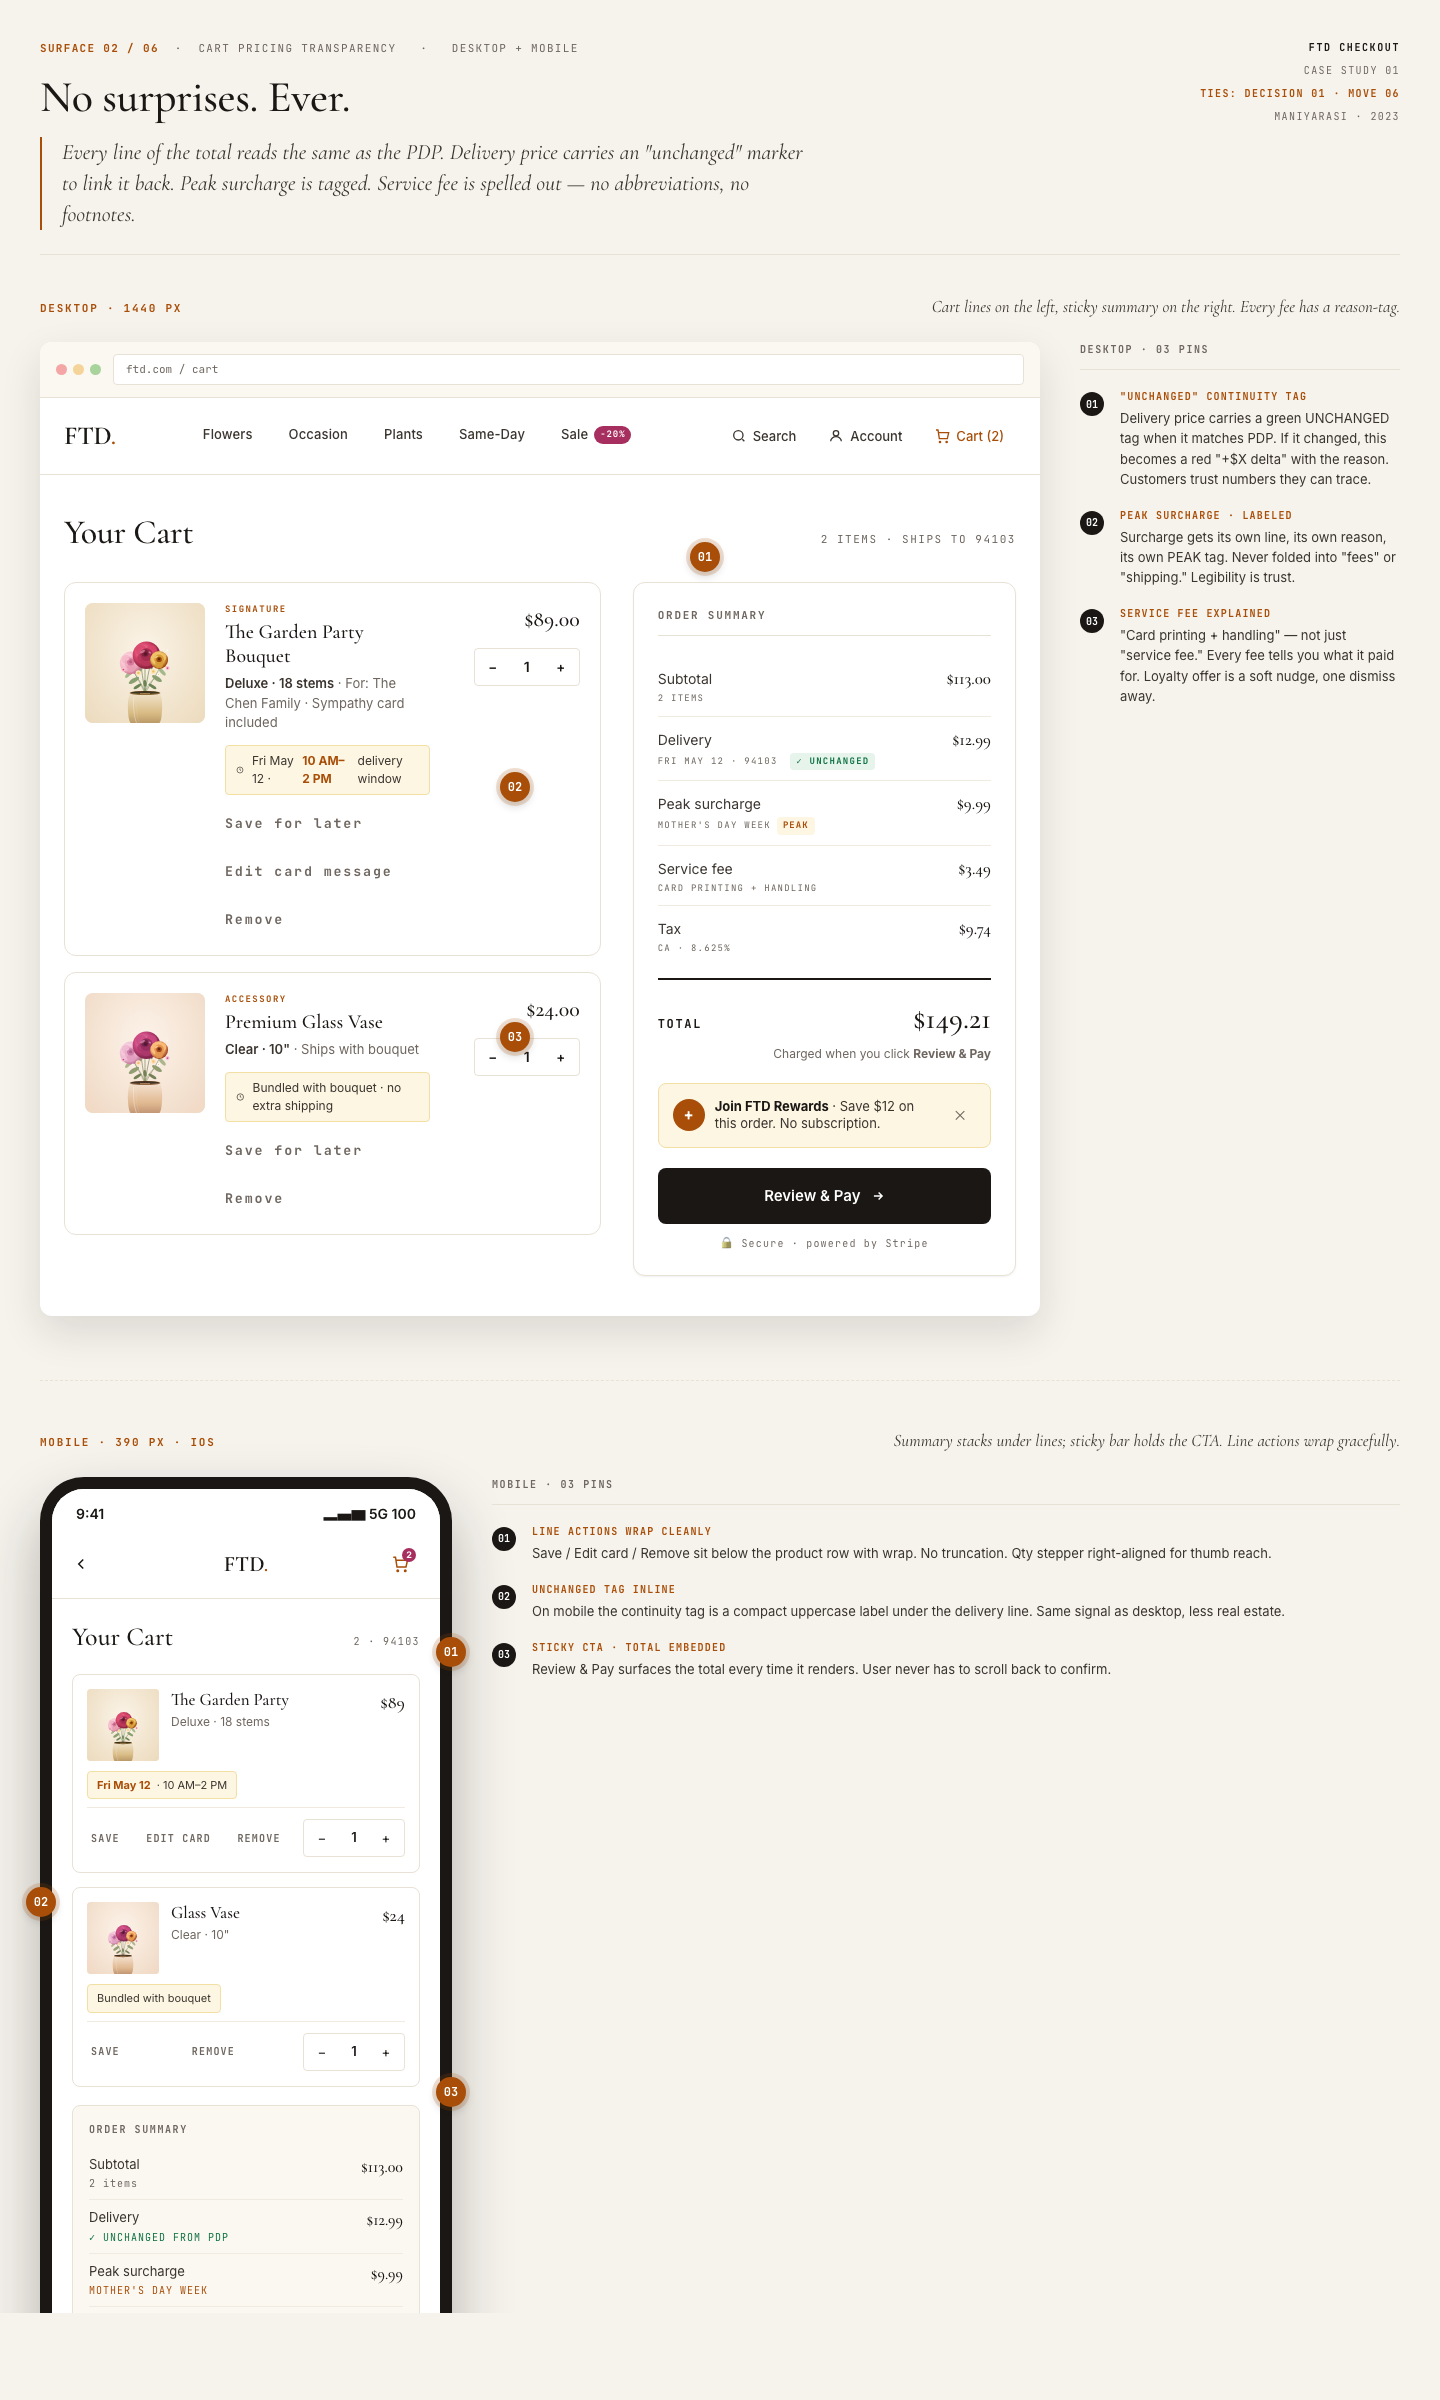
CART, PRICING TRANSPARENCY
The number the user sees on the PDP is the number the user pays at checkout. Nothing appears late.
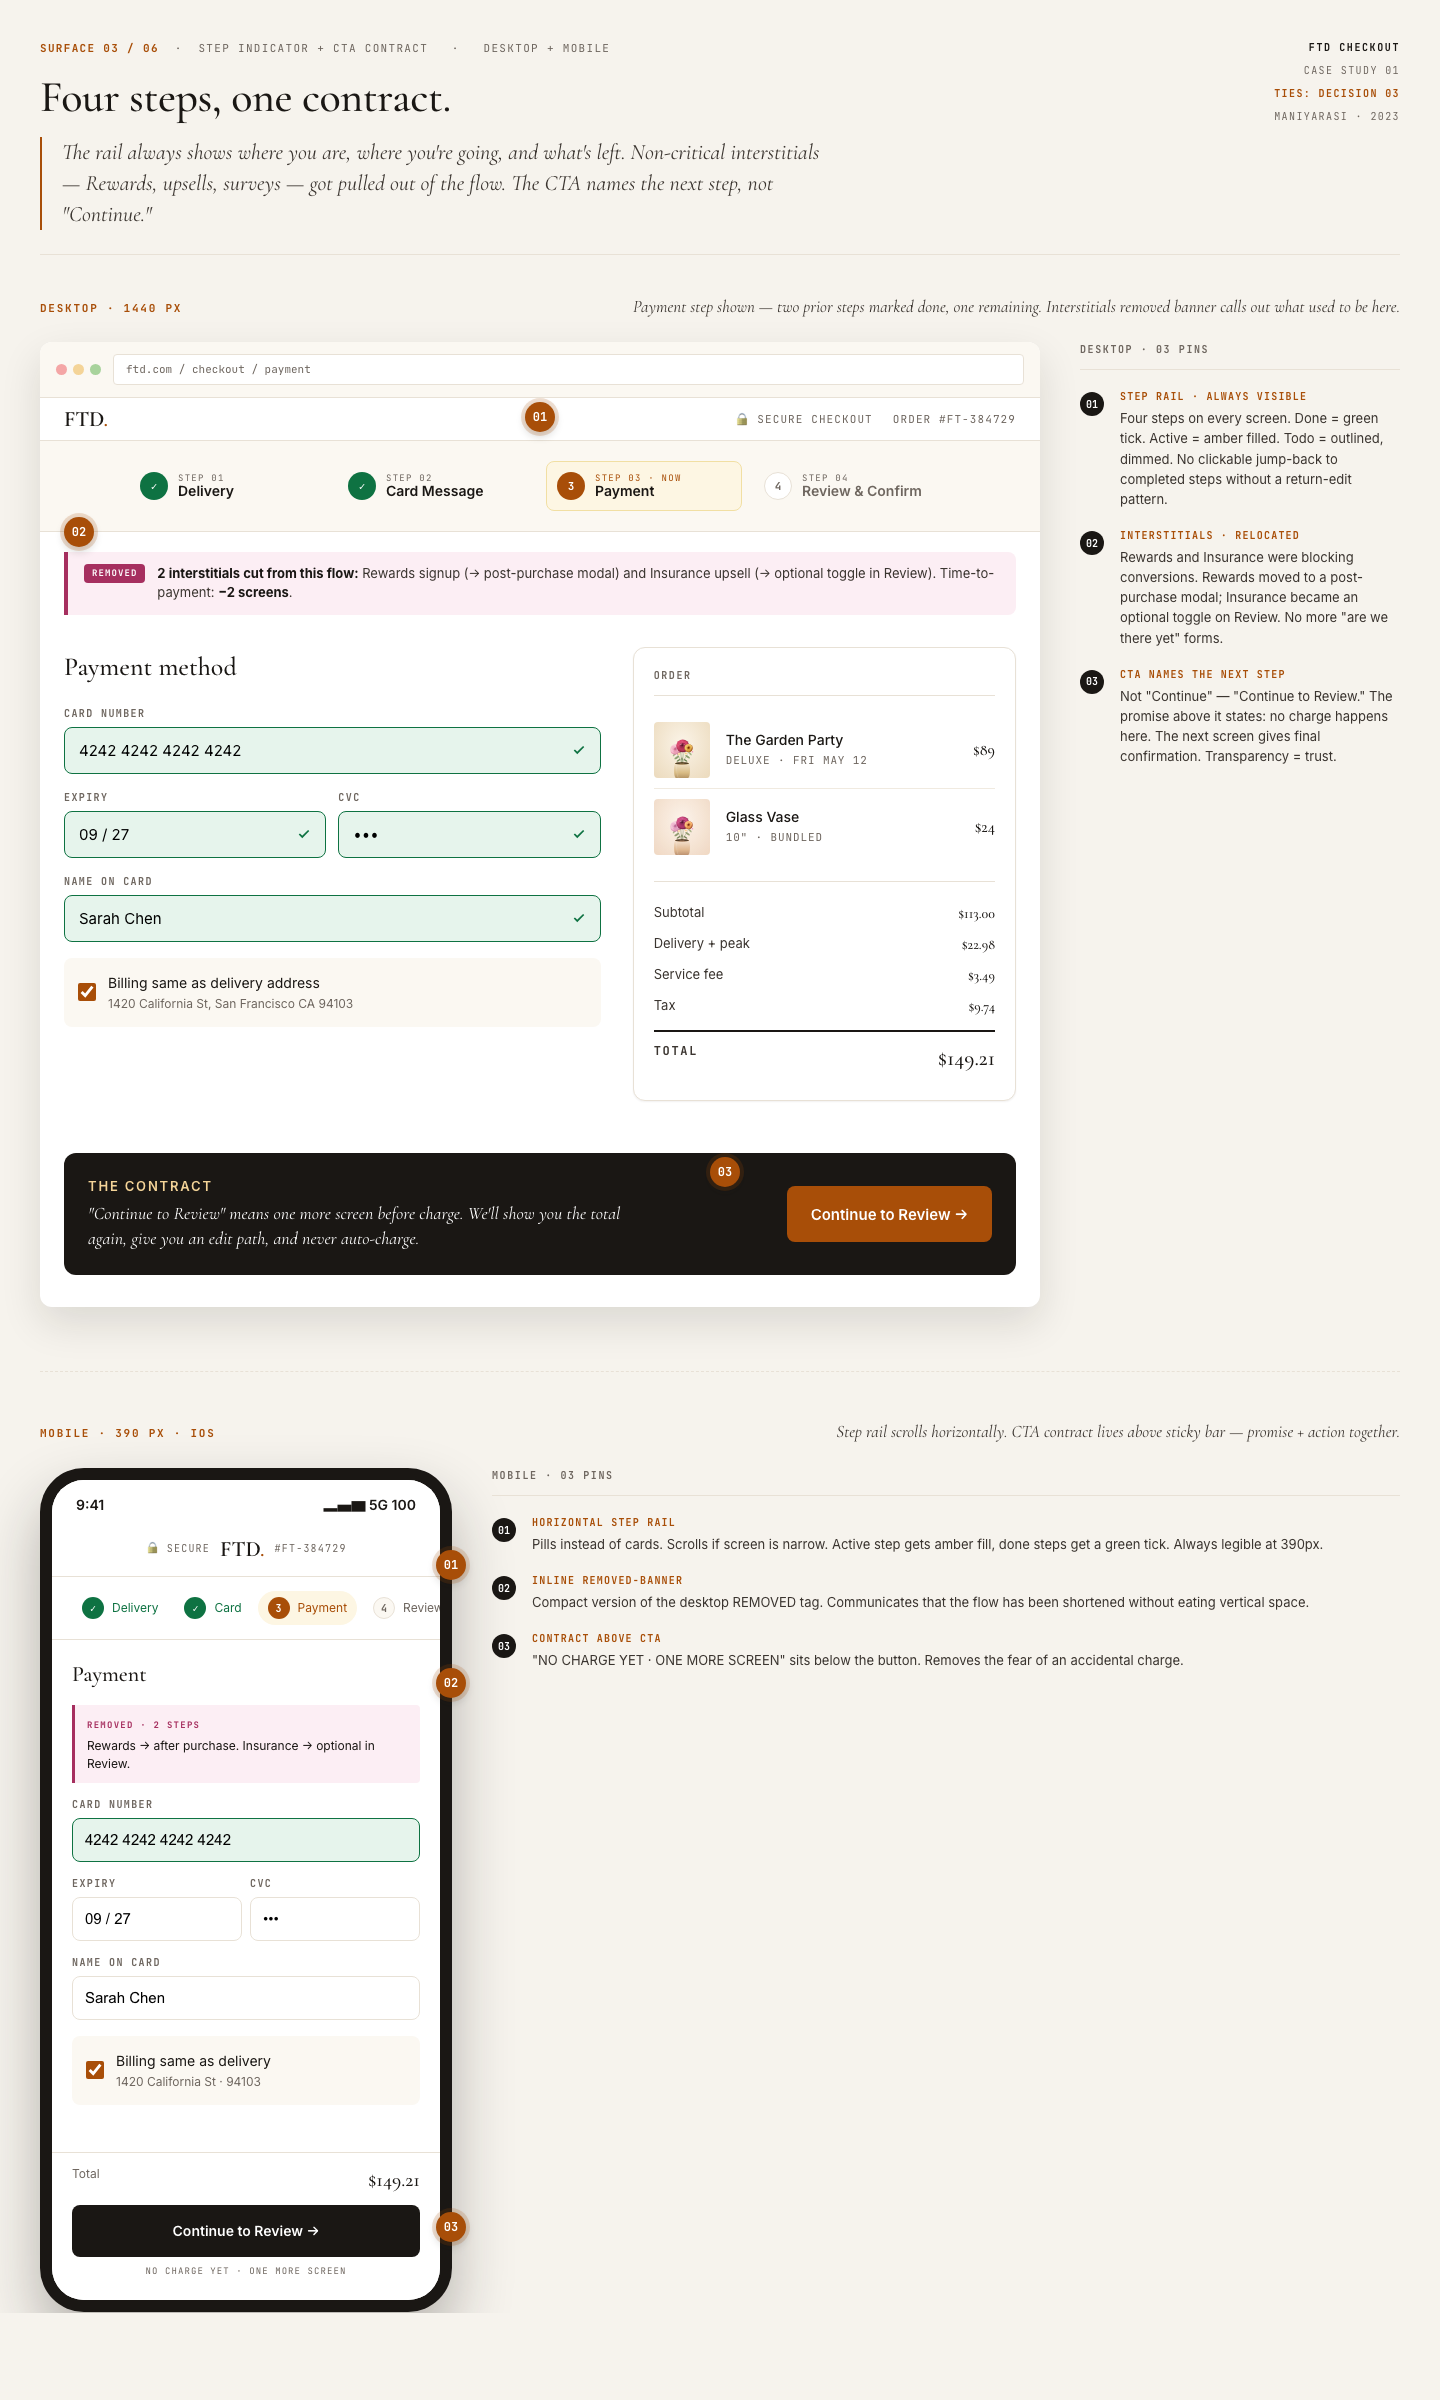
CHECKOUT, STEP INDICATOR AND CTA CONTRACT
The flow's shape is visible from inside the flow. The button tells the user where it leads.
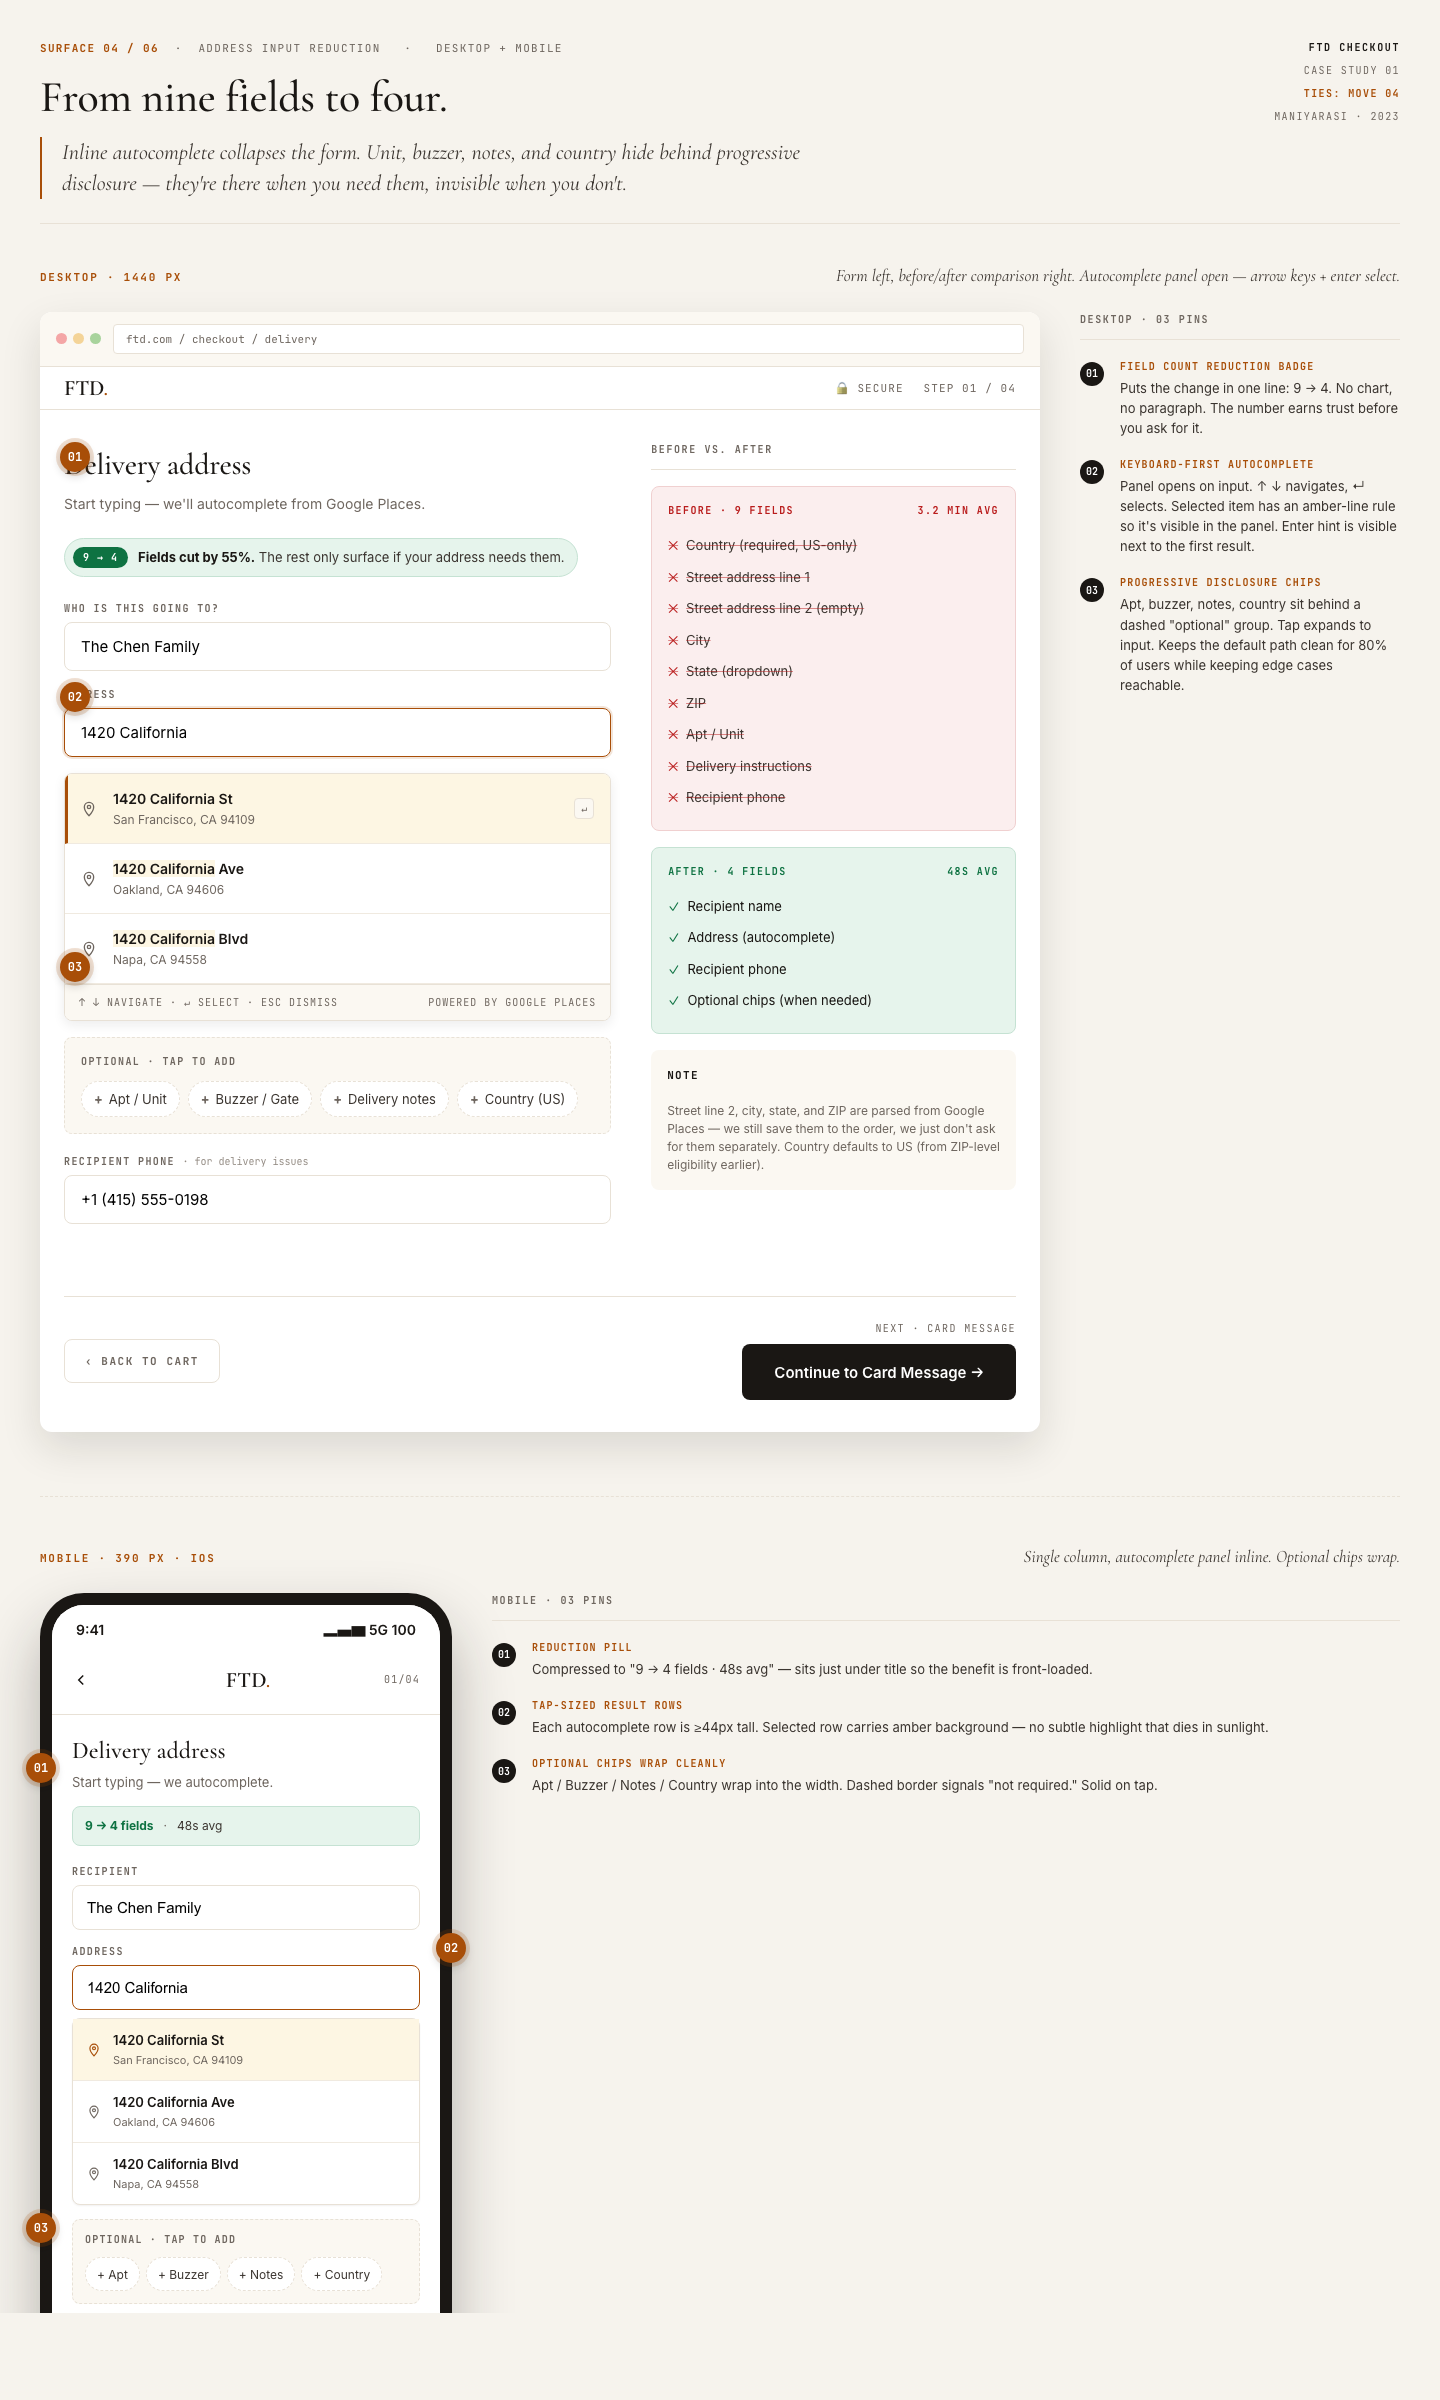
ADDRESS ENTRY, INPUT REDUCTION
Every field justifies itself. The form asks only what the system can't infer.
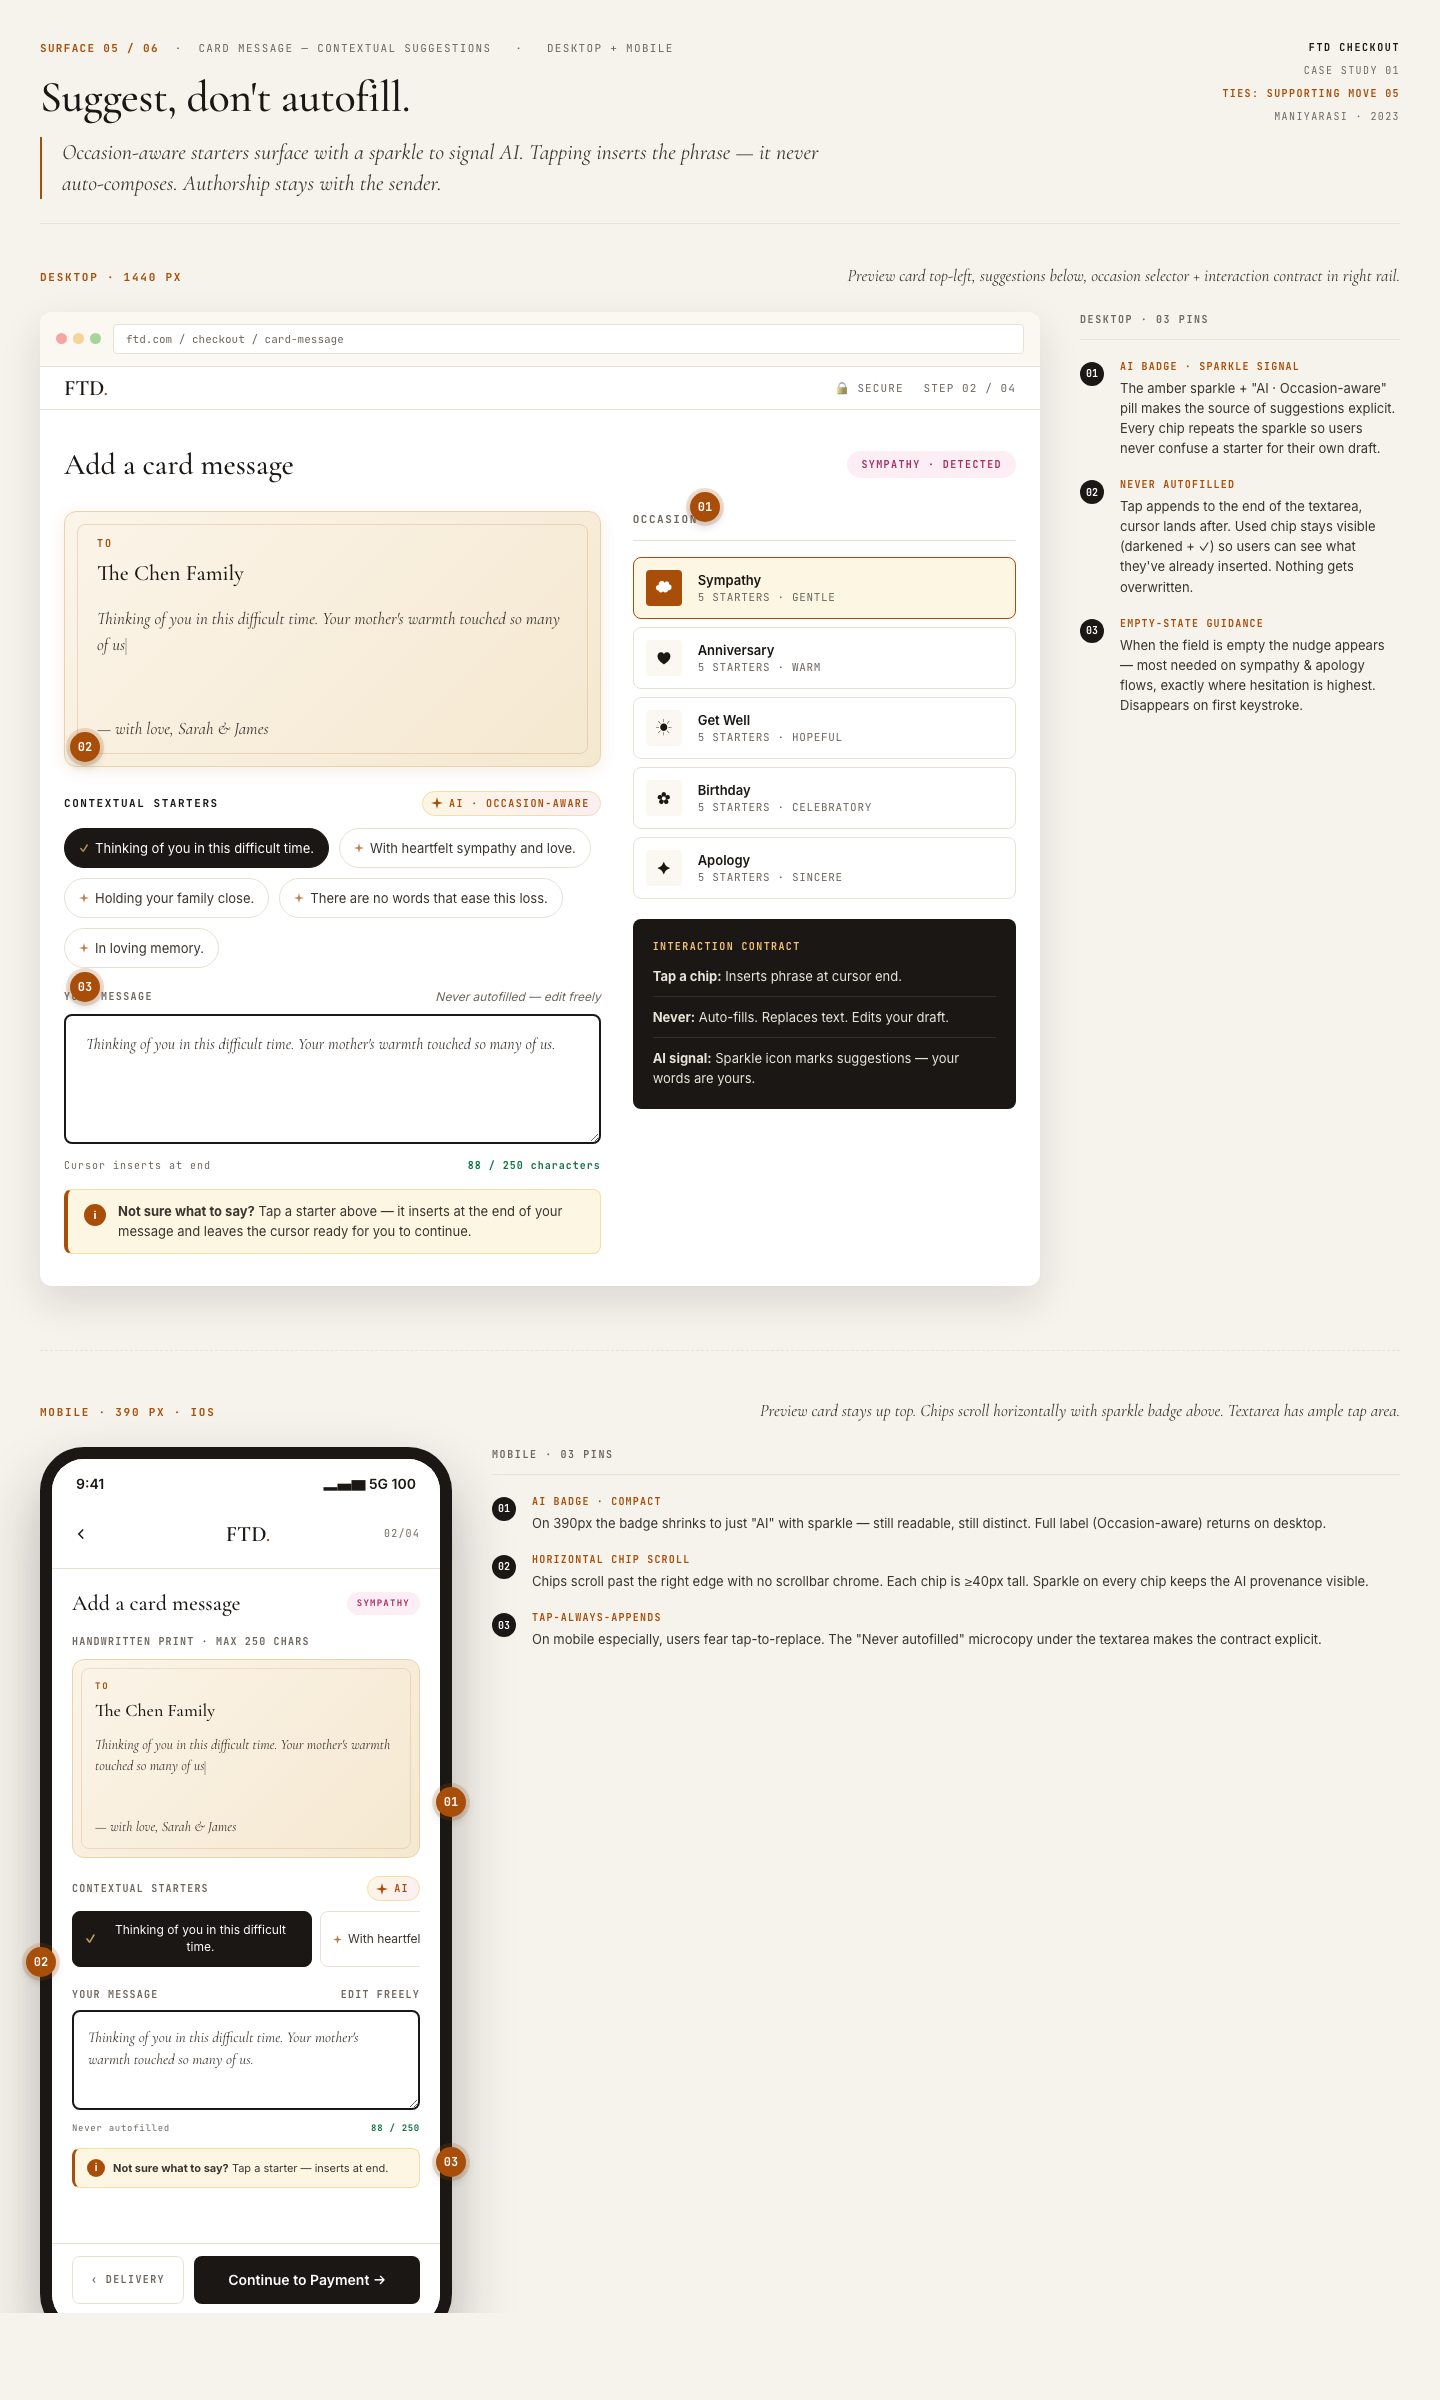
CARD MESSAGE, CONTEXTUAL SUGGESTIONS
Suggest, don't autofill. Reduce hesitation without removing authorship.
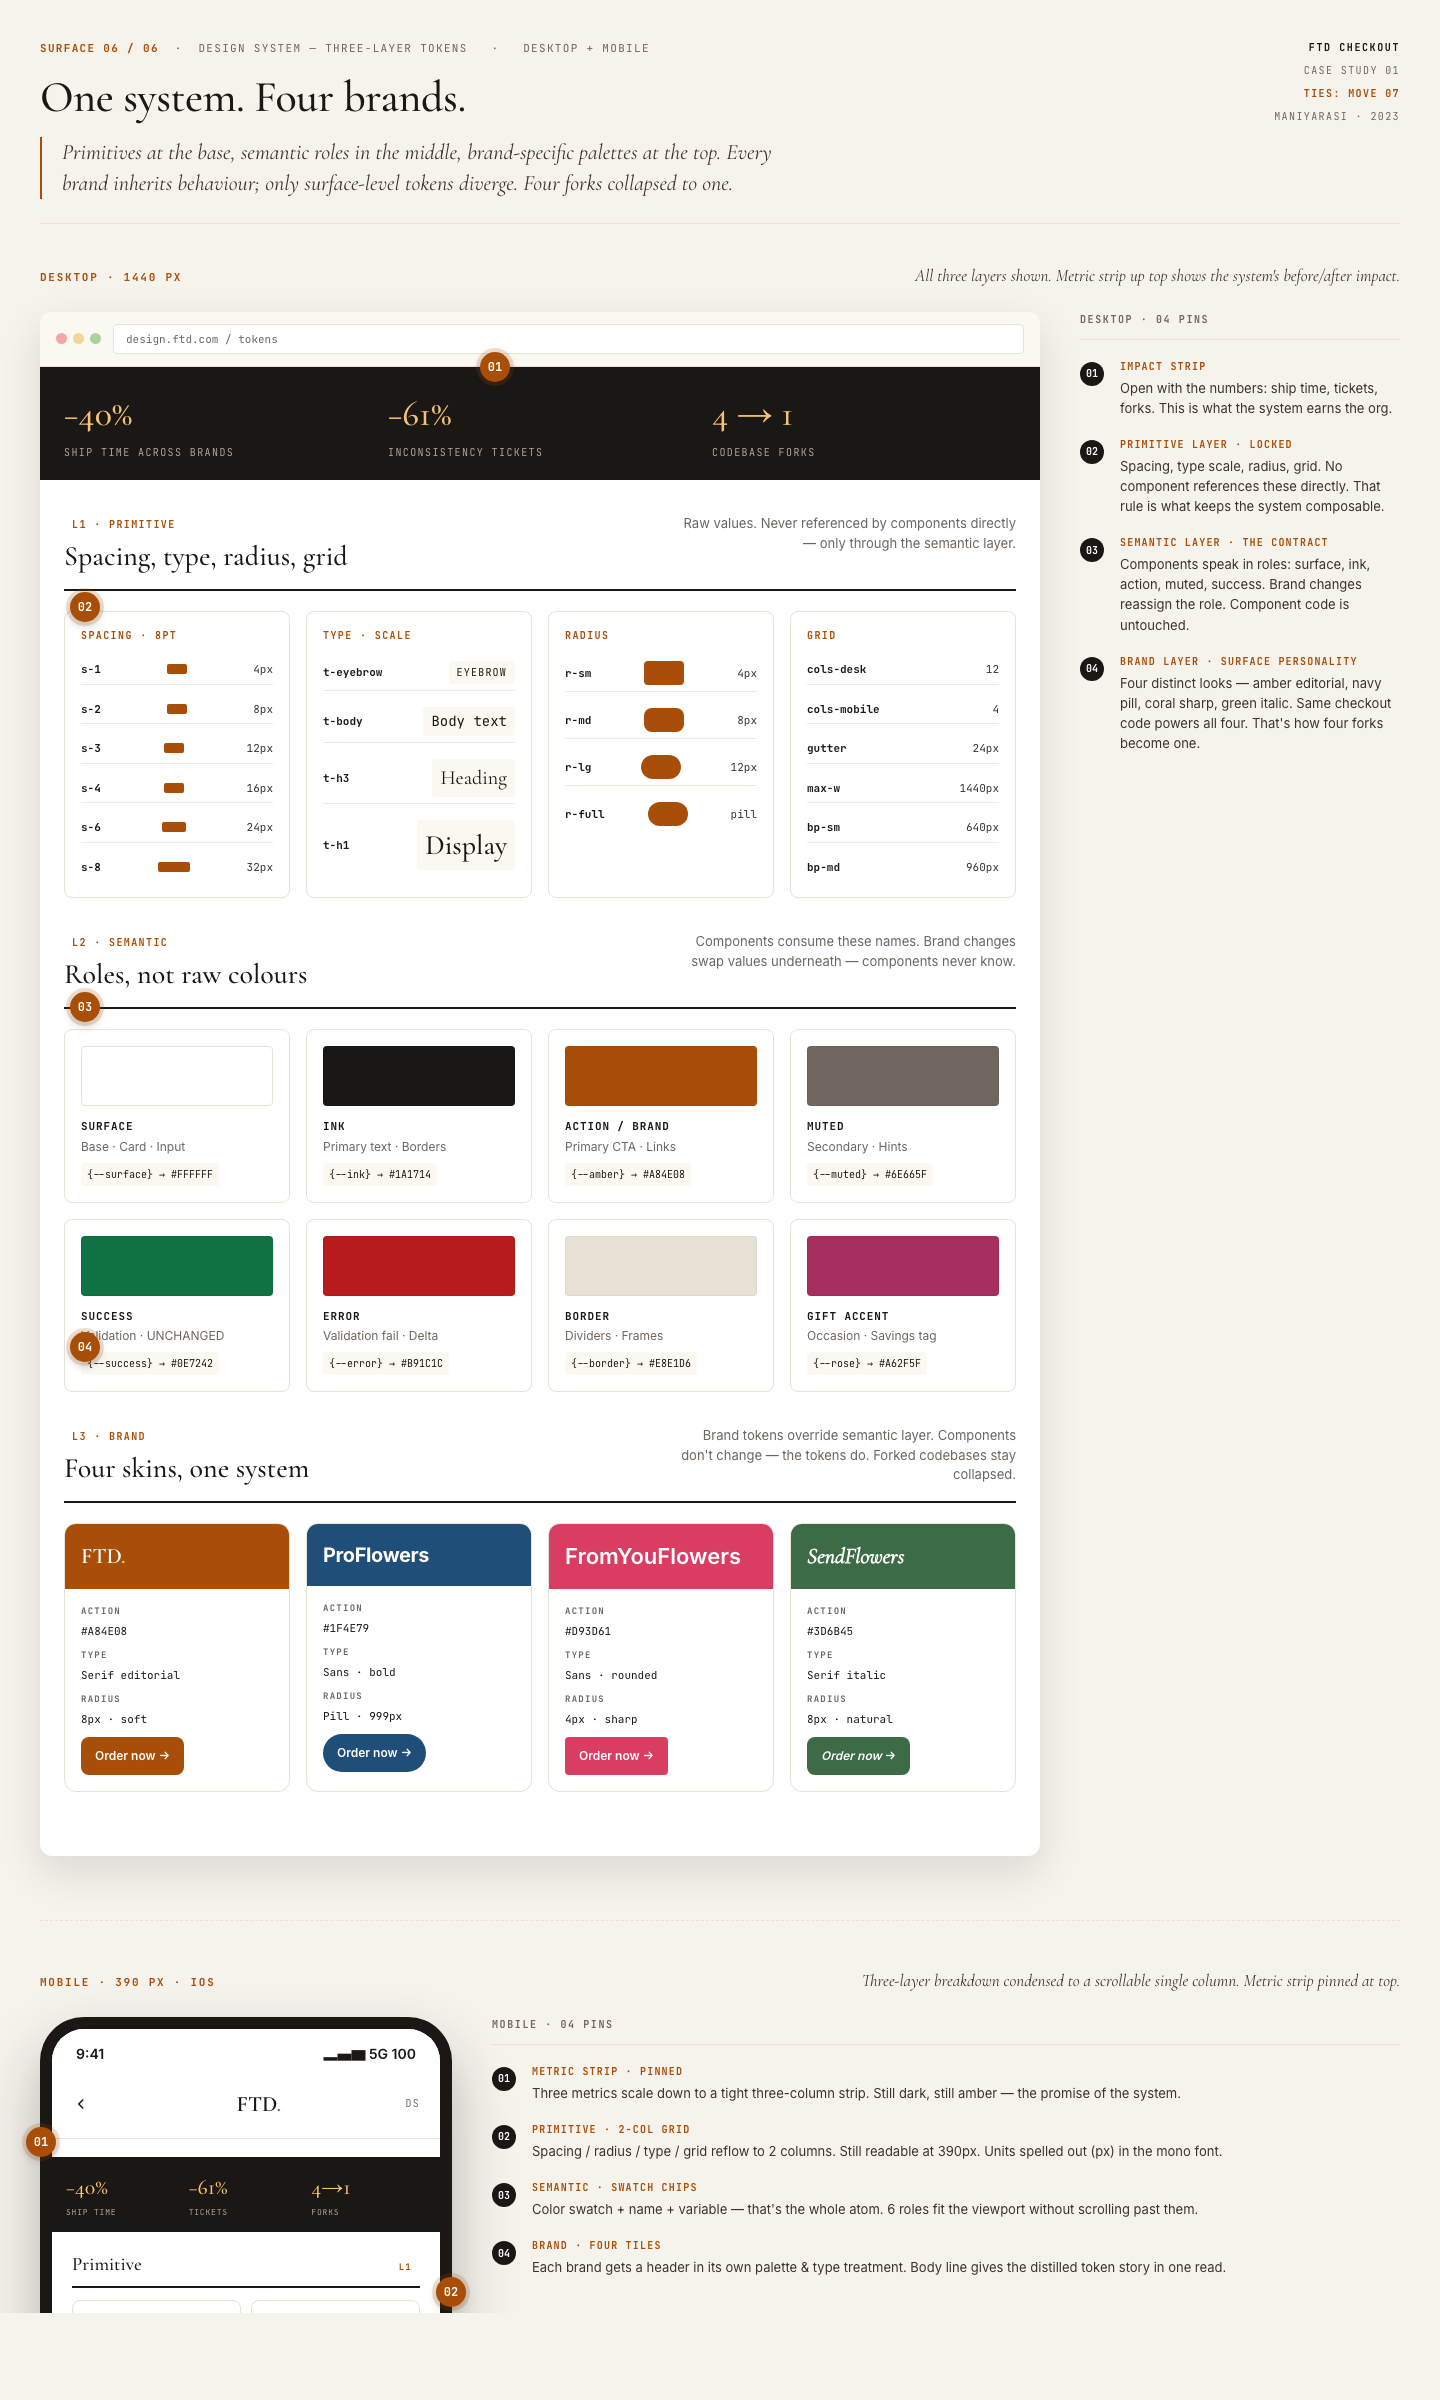
DESIGN SYSTEM, MULTI-BRAND TOKENS
Four brands, one checkout. Consistency under the surface; brand voice above it.
SECTION 06IMPACT
Measured over two quarters. What moved.
ALL FIGURES: CONTROLLED A/B · PRIMARY ANALYST: GROWTH TEAM · METHODOLOGY NOTED PER METRIC
Secondary signals
| Signal | Lift |
|---|---|
| Repeat purchase (60-day) | +9% |
| Loyalty enrollment from cart | +2.4× |
| Support tickets re: pricing | −41% |
| Substitution acceptance rate | 2.1× (among validation-failed users) |
| Time on checkout steps 2–3 | −30% median |
| Cross-brand feature ship time | −40% |
METHODOLOGY · WHAT THE NUMBERS ARE AND AREN'T
Primary conversion and abandonment figures were measured via controlled A/B tests run by the growth analytics team, not self-reported. Each test ran for a minimum 14-day window to absorb weekly cyclicality. Peak windows (Mother's Day, Valentine's Day) were excluded from the primary reads and measured separately, because user behavior during those windows is sufficiently distinct to require its own baseline.
Ranges (e.g., "−20 to −30%") reflect variance across the four brands. I've reported the range honestly rather than averaging to a single number; the average would have overstated the weakest brand's result and understated the strongest.
Efficiency metrics are internal, not externally audited. Ship time was measured against a pre-consolidation baseline from the two quarters prior to the design system work. Support-ticket volume is pulled from the internal CS dashboard and filtered to checkout-related categories only.
The +30% headline figure represents sustained performance across two full quarters, not a single-week peak.
WHAT THIS SECTION DOESN'T SHOW
- Revenue figures are withheld under NDA. The conversion lift translates to a material number; I can discuss magnitude in a conversation, not in writing.
- Two of the four brands have since been restructured or sunset for reasons unrelated to the checkout work. The design system artifacts remain in use by the surviving brands.
- I did not run the A/B tests myself. The growth analytics team owned measurement; I owned the hypothesis and the design. I've noted this because hiring managers sometimes ask, and I'd rather be clear about it than overclaim.
- The loyalty enrollment gain (+2.4×) applies to the cart-surface placement specifically. Program-wide enrollment moved by a smaller margin; I'd cite the smaller number if asked which matters more.
SECTION 07POSTMORTEM
The most durable lesson from this project is that the biggest gains came from structural clarity, not new UI. A pricing strip, a validation posture, a step-labeling contract. None of it would win a Dribbble shot, and all of it moved the business number by compounding. The discipline was reading the system as one surface across four brands and designing the coherence, not the decoration.
The reframe, that the checkout was a symptom and not the problem, is the move I'd repeat on any similar engagement. Expanding scope against stakeholder expectation is a different kind of design work than shipping pixels, and it turned out to be the work that mattered most here.
Looking forward, there are two things I'd push on earlier next time: tying peak-mode escalation to real network capacity rather than calendar dates, and designing subscription and multi-recipient flows into the foundation rather than bolting them on later. Both were visible in spec. Both got descoped under pressure. Holding a scope boundary under that kind of pressure is a skill I left this project better at than I started with.
I'm proud of the +30% lift. I'm prouder of the judgment calls underneath it.